There were 18,383 items sold in April 2019, with 17538 unique orders and 20 unique products. How do we figure out which pairs of products to market together to lift sales the next month? The unique products (electronics) available in the dataset are shown below:
                index                         ...
Product  20in Monitor 27in 4K Gaming Monitor  ... Wired Headphones iPhone
Order ID                                      ...
176558            NaN                    NaN  ...              NaN    NaN
176559            NaN                    NaN  ...              NaN    NaN
176560            NaN                    NaN  ...              1.0    NaN
176561            NaN                    NaN  ...              1.0    NaN
176562            NaN                    NaN  ...              NaN    NaN

[5 rows x 20 columns]
#Fill null values in the dataframedf_orders = df_orders.fillna(0)df_orders.head()
i.e. how frequently the item occurs over the total number of orders
We only count each item once in an order for simplicity.
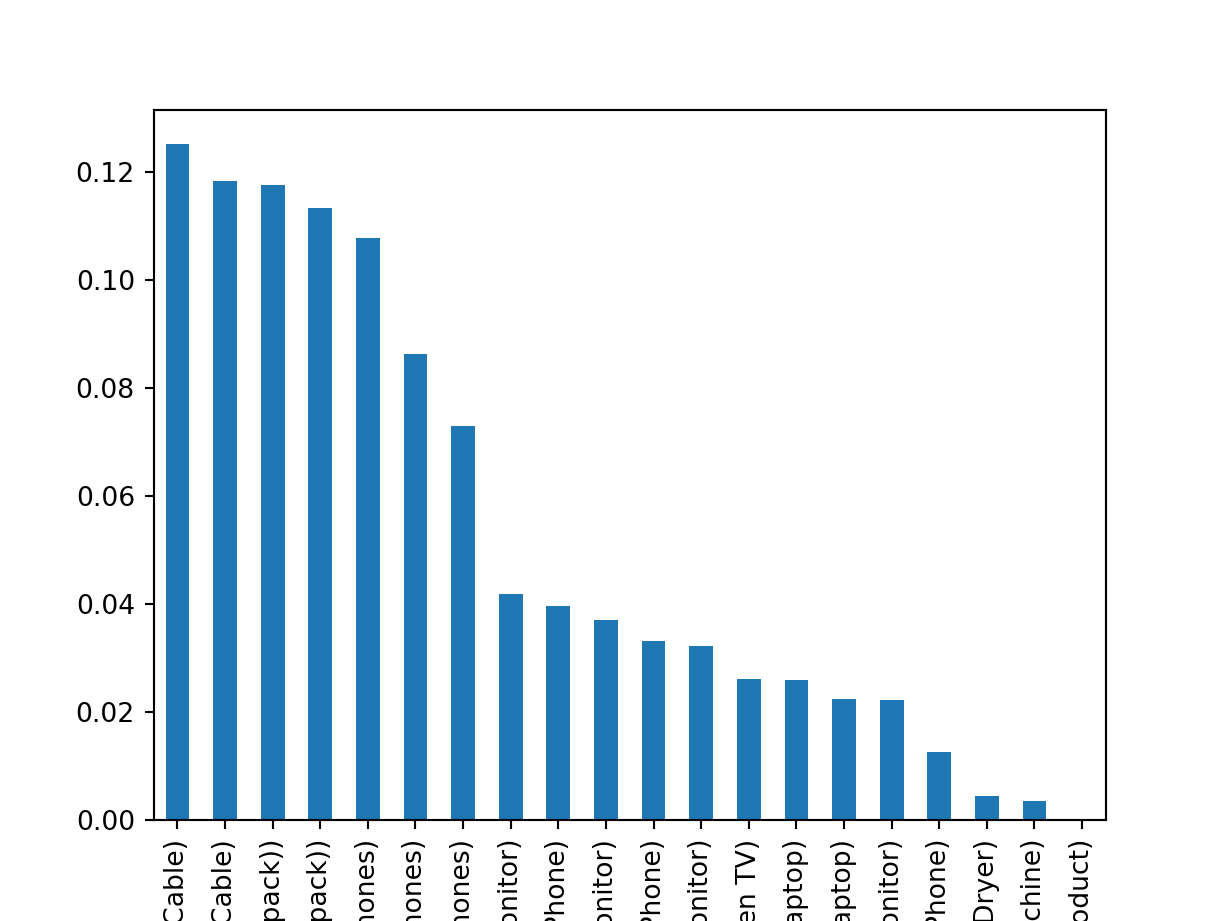
Based on the summary below it looks like lightning charging cables, USBC, AA Batteries, Wired headphones and airpods are more frequent selling items. However, note that low support items are more expensive so it’s a good idea to cross sell them alongside a high frequency selling item
#Convert df orders to booleancol_names = df_orders.columnsdf_orders = df_orders[col_names].astype('bool')df_orders.head()
Use the apriori algorithm to identify a set of meaningful rules
These rules will help cross sell products that go well together to boost sales. For example, if we want to increase the sales of headsets - would it make more sense to cross sell the mackbook pro with the airpods or with the bose headphones? We will only consider cross selling pairs of items together so this will consider 2 rule combinations only
from mlxtend.frequent_patterns import association_rulesfrom mlxtend.frequent_patterns import apriori
#Compute items that sell at minimum in 0.001% of all orders placed in the month (min_support)frequent_itemsets = apriori(df_orders, min_support =0.00000001,max_len =2, use_colnames =True)
#Compute pairs of orders that have a meaningful lift of more than 1 in their sales when marketed togetherfrequent_itemsets_rules = association_rules(frequent_itemsets,metric ="lift", min_threshold =1.0)
Though more close inspection of all individual pairs of items is needed, this dataset shows that marketing USB sales with google phones can lift the sales of individual items. However, we should also consider other metrics such as the support of individual items. For example, USB cables and lightning charging cables also sell well on their own. However, retailers may get a slight boost in the sales of their phones if they pair them up with the cables as well